PROJECT: TravelBuddy
1. Overview
This document serves to highlight my contributions to TravelBuddy, a travel log application that allows users to efficiently manage their travel records, i.e. the places that they have visited. Additional features built into TravelBuddy allows them to search through the records, attach photos and view statistical models. This team-based project is part of the CS2103T Software Engineering module in National University of Singapore, in which my team and I were tasked to morph a given address book product into a new product — TravelBuddy. The complete source code for TravelBuddy is available on GitHub.
My role was to design the chart feature. The following sections describe the enhancements I made in greater detail. They also include relevant sections from the user and developer guide related to these enhancements.
2. Summary of Contributions
This section summarizes my contribution to this project.
2.1. Major Enhancement
The major enhancement I did was adding the ability to generate charts in real-time or via the generate command, the details of which are stated below:
What it does: It allows users to generate charts based on their travel data that they have accumulated in TravelBuddy.
Justification: This feature allows users to gather insights into their travel patterns. It improves the user-friendliness of TravelBuddy while giving it additional functionality. As such, this feature is the differentiating factor for TravelBuddy among other travel log products on the market.
Highlights: The complexity of this enhancement is due to the fact that it links up with all the components of the existing architecture, as described below:
-
Logic: The chart feature can be activated via the
generatecommand. Hence, a parser is required to parse the command. -
Model: Any changes made to the travel records has to be reflected in the charts. Hence, relevant data is extracted from the latest version of the travel records.
-
Storage: The extracted data has to be stored into the charts' respective JSON files.
-
User Interface (UI): The charts have to be displayed to the users.
The enhancement required an in-depth analysis of various design alternatives. The challenge was to redesign the architecture to suit the enhancement while still maintaining the integrity of other existing commands and features.
Credits: Gson, a third-party library, was used in the enhancement of this product to convert Java Objects into JSON and back.
Code contributed to the major enhancement: [RepoSense] [Functional code] [Test code]
2.2. Minor Enhancement
The minor enhancement I did was converting the add command’s Email parameter in the previous address book product to a Description parameter in the current product. The Description parameter allows users to note down their thoughts about the specific place that they have visited.
Additionally, I added command aliases to new and existing commands so users have the option to input a shorter command.
Code contributed to both minor enhancements: [Functional code]
2.3. Other Contributions
The details of other contributions can be found in Table 2.3.1 below:
Project management |
Managed releases on GitHub (Releases: |
Enhancements to existing features |
|
Documentation |
|
Community |
|
Tools |
3. Contributions to the User Guide
The original User Guide was updated to match the enhancements implemented in this project.
3.1. Generating Charts: generate
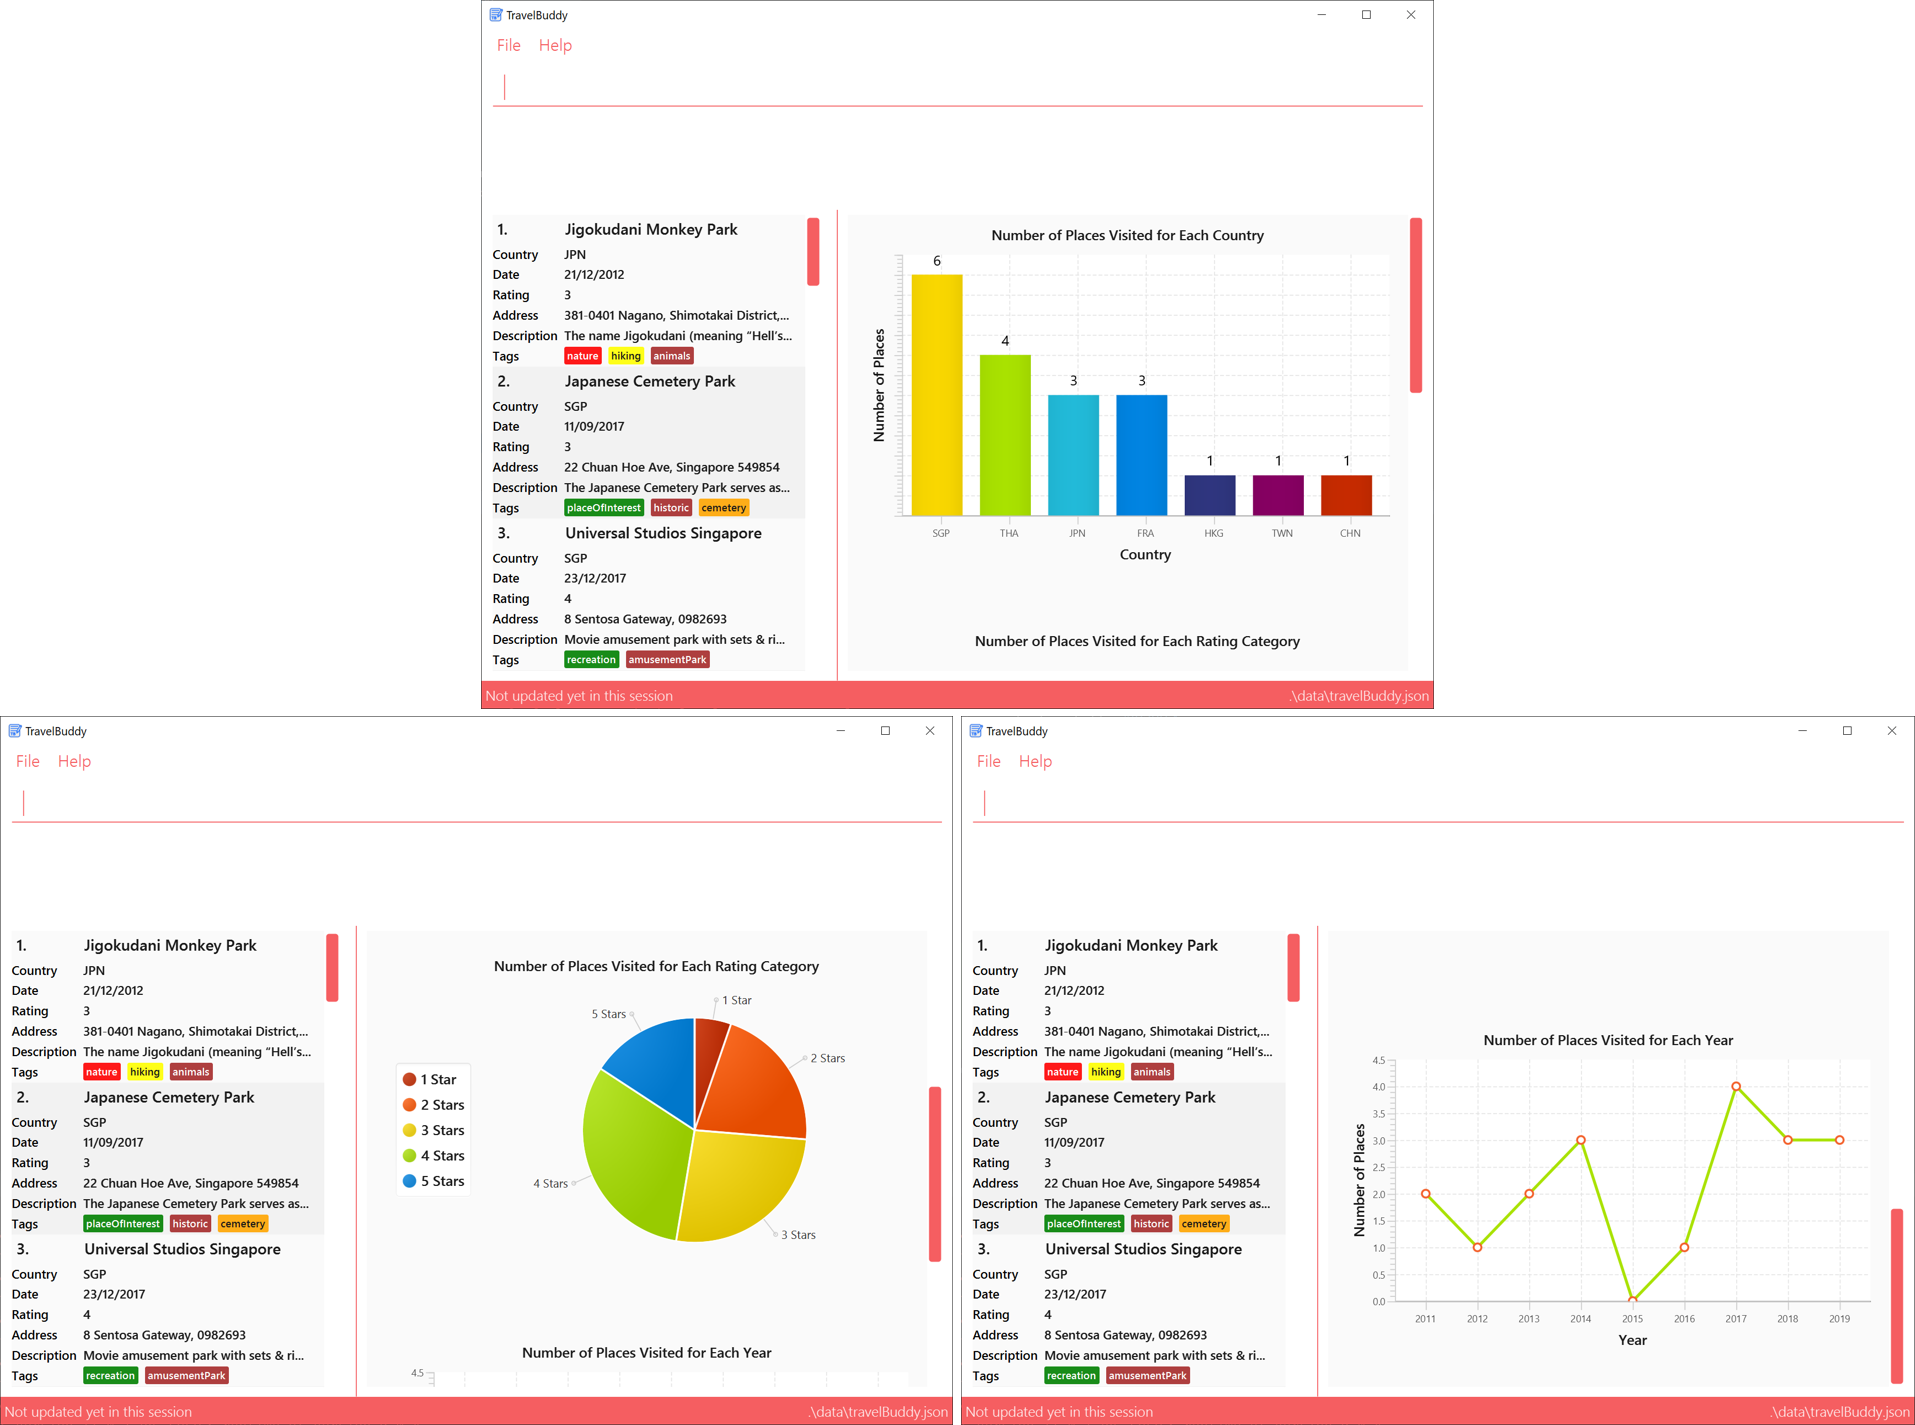
Description: The generate command generates charts based on the list of places in TravelBuddy. TravelBuddy serves up three charts (Figure 4.17.1) that are the most relevant to you as a traveler:
-
The number of places visited for each country
-
The number of places visited for each rating category
-
The number of places visited for each year
Shortcut: g
Format: generate
Preconditions: Given below is a list of preconditions that must be met for the generate command to work:
-
By default, the charts are automatically generated each time TravelBuddy loads.
-
The
generatecommand always triggers the display of all three charts, as seen in Figure 4.17.1. -
The charts always update themselves in real-time.
Example: When a place is added via theaddcommand, the charts are automatically updated so that nogeneratecommand is necessary. -
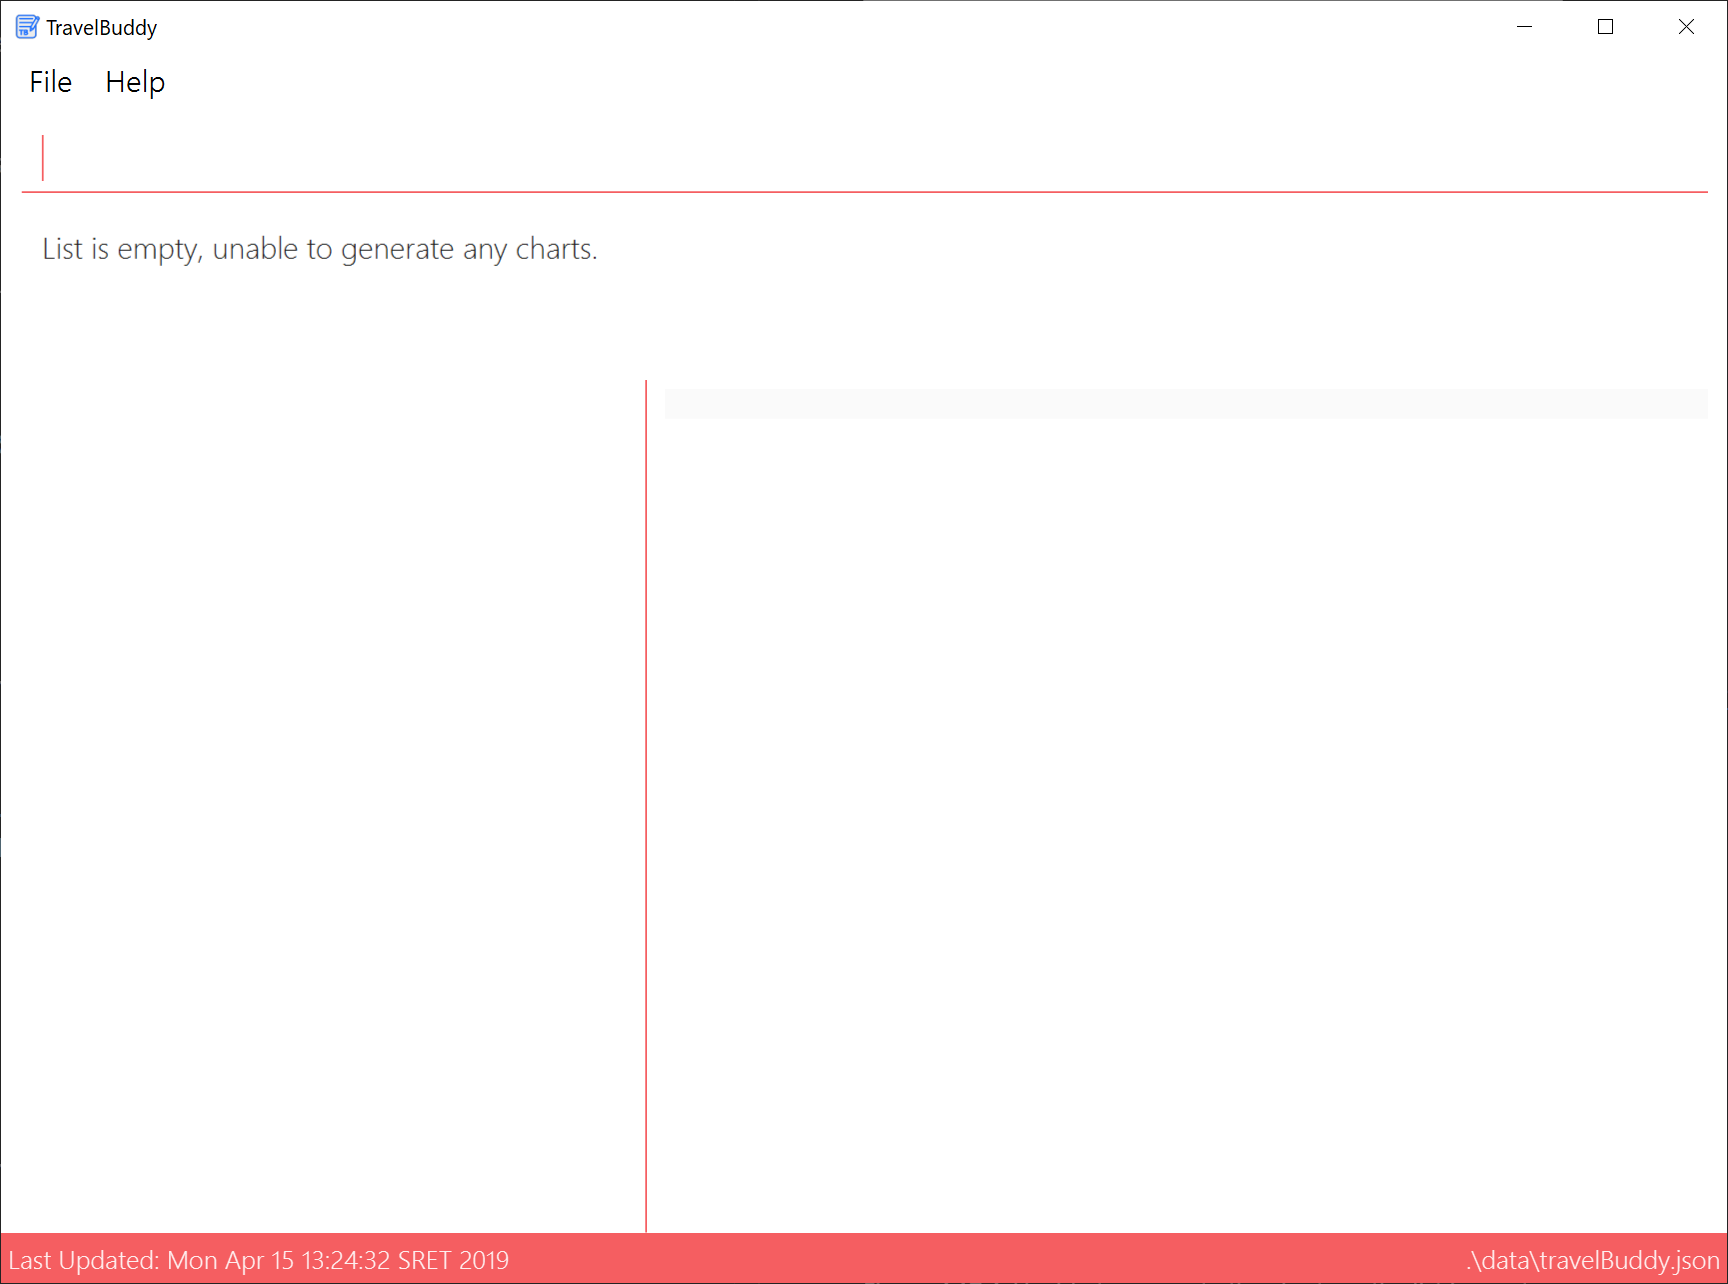
If the list is empty, the
generatecommand will not display any charts (Figure 4.17.4). -
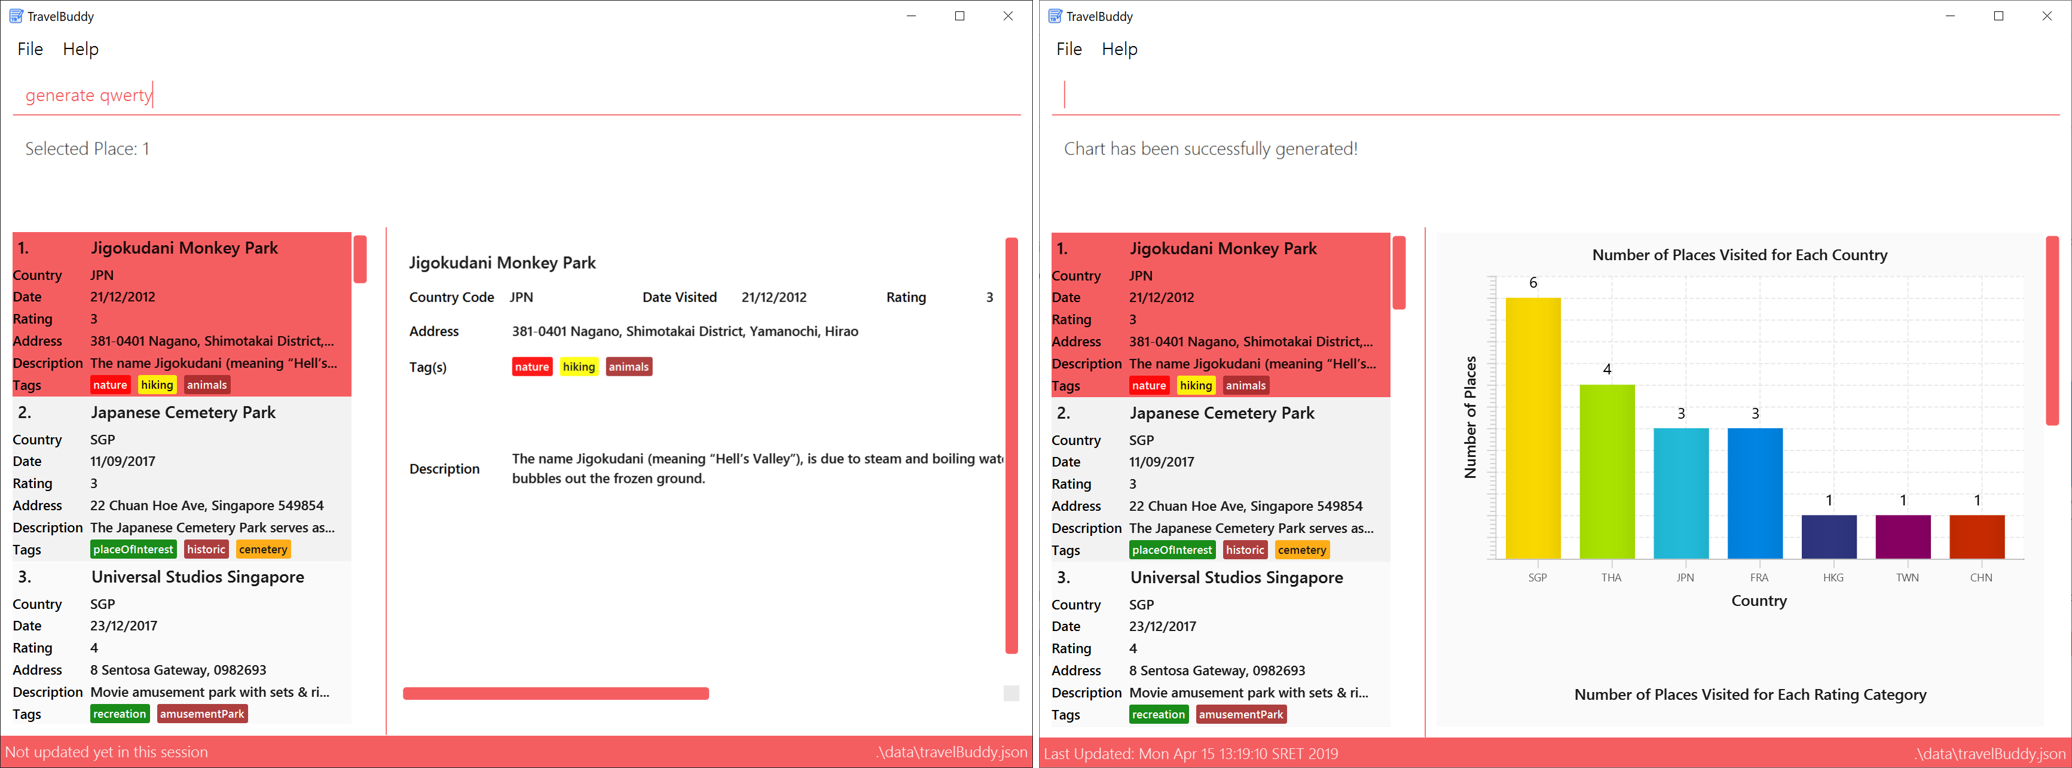
You can type in any parameters after the
generatecommand, TravelBuddy will simply ignore them (Figure 4.17.2).
generate commandExamples: Given below are some examples on how to utilize the generate command:
-
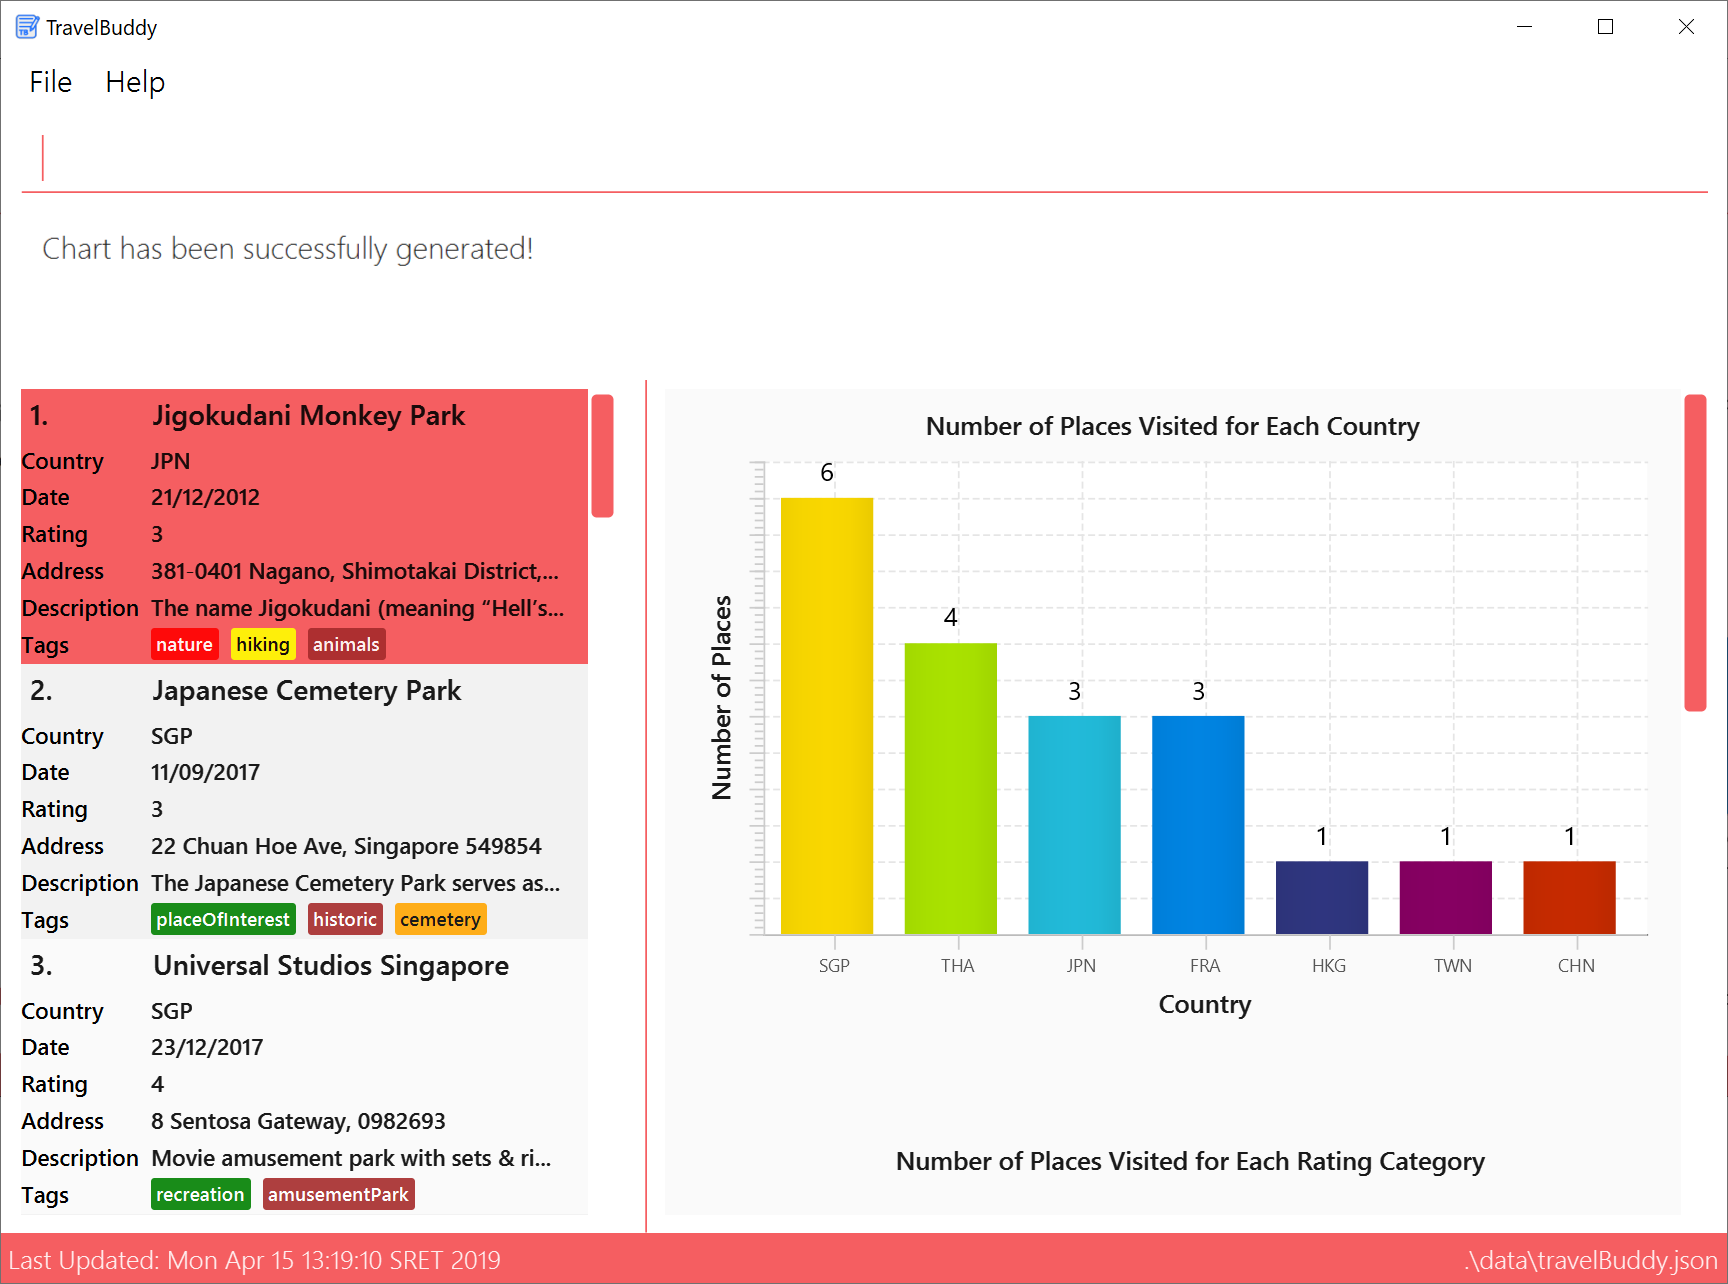
select 1
Selects the 1st place in the current list displayed.
generate
Generates the charts.
Outcome: The charts were successfully generated, as seen in Figure 4.17.3 -
clear
Clears all places in the list.
generate
Generates the charts.
Outcome: Unable to generate the charts as the list is empty, as seen in Figure 4.17.4
4. Contributions to the Developer Guide
The original Developer Guide was updated to match the enhancements implemented in this project.
4.1. Chart Feature
The Chart feature displays to users three different charts in TravelBuddy. They are:
-
The Number of Places Visited by Rating Category
-
The Number of Places Visited by Year
-
The Number of Places Visited by Country
The Chart feature is activated in TravelBuddy by default when the application launches. Alternatively, the generate command is also used to generate the charts. The generate command does not require any parameters.
Instead of typing generate, you can simply type the shortcut g.
|
4.1.1. Current Implementation
Logic: The generate mechanism is executed by GenerateCommand, which extends from Command. A code snippet is shown below:
public CommandResult execute(Model model, CommandHistory history) {
    requireNonNull(model);
    model.setChartDisplayed(true); (1)
    model.commitTravelBuddy(); (2)
    if (model.getFilteredPlaceList().isEmpty()) { (3)
        return new CommandResult(MESSAGE_EMPTY);
    } else {
        return new CommandResult(MESSAGE_SUCCESS);
    }
}
In the snippet, the operations implemented are:
-
Model#setChartDisplayed(chartDisplayed)- Signals to the UI to display the charts. -
Model#commitTravelBuddy()- Saves the current TravelBuddy state from its history. -
Model#getFilteredPlaceList()- Verifies if the list is empty.
These operations are exposed in the Model interface as Model#setChartDisplayed(chartDisplayed), Model#commitTravelBuddy() and Model#getFilteredPlaceList().
Model: The chart generation mechanism is facilitated by VersionedTravelBuddy, which extends from TravelBuddy, as seen in the Model Class Diagram in [ModelClassDiagram].
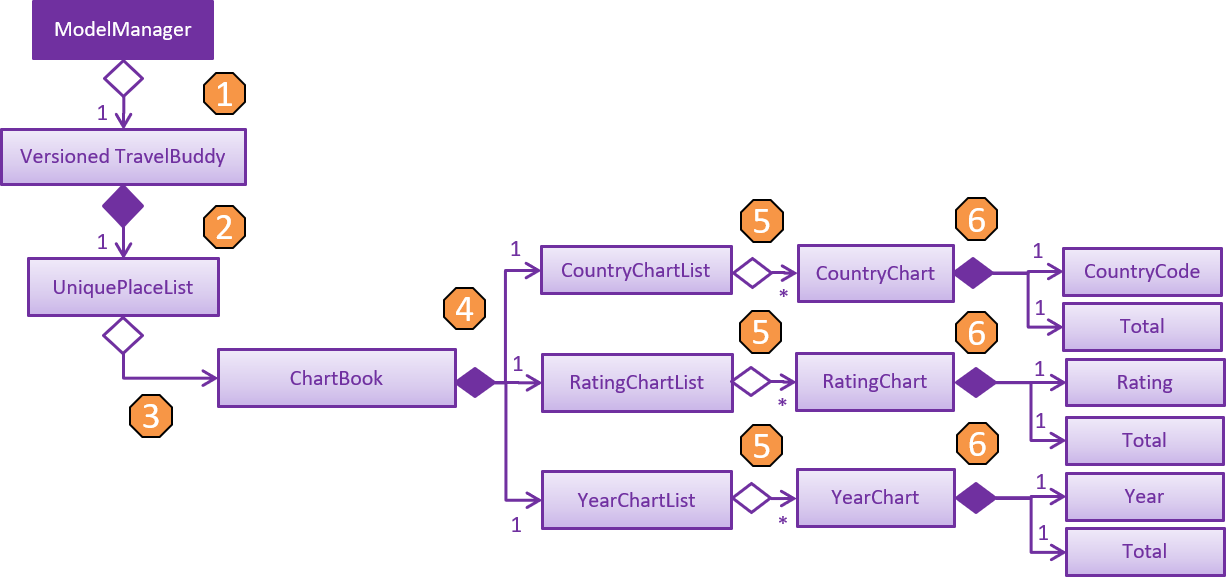
For this section on Charts, the focus is on the class diagram as seen in Figure 4.5.1.1. The step-by-step explanation of the class diagram can be found below:
-
The
ModelManageris a container for aVersionedTravelBuddyobject. -
VersionedTravelBuddy consists of a
UniquePlaceListobject. -
UniquePlaceListis a container for one or moreChartBookobjects and for one or morePlaceobject. -
ChartBookconsists of aCountryChartListobject, aRatingChartListobject and aYearChartListobject. -
countryChartListis a container for one or moreCountryChartobjects. Similarly,ratingChartListis a container for one or moreRatingChartobjects andyearChartListis a container for one or moreYearChartobjects. -
CountryChartconsists of aCountryCodeobject and aTotalobject. Similarly,RatingChartconsists of aRatingobject and aTotalobject andYearChartconsists of aYearobject and aTotalobject.
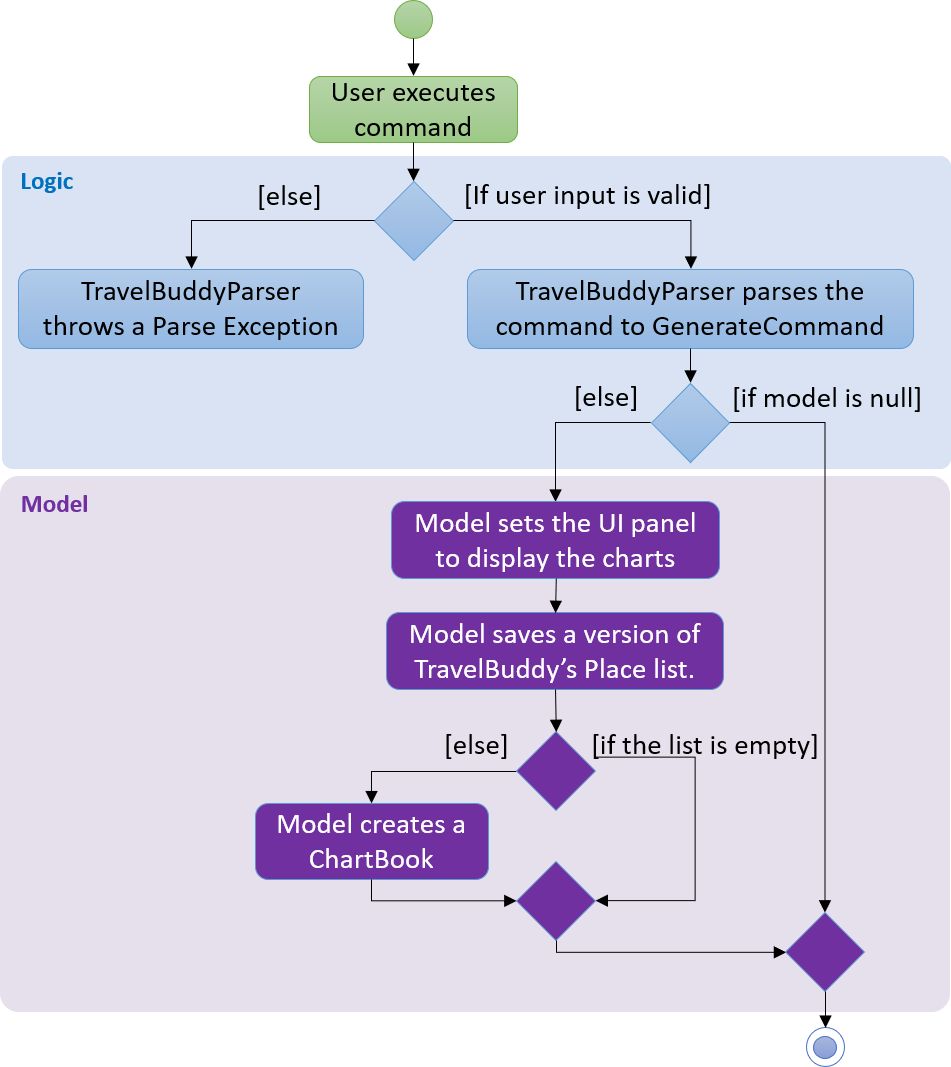
generate commandLogic & Model Interaction: Having discussed Logic and Model, we can now model the workflow of the generate command. This can be accomplished using an activity diagram, as seen in Figure 4.5.1.2.
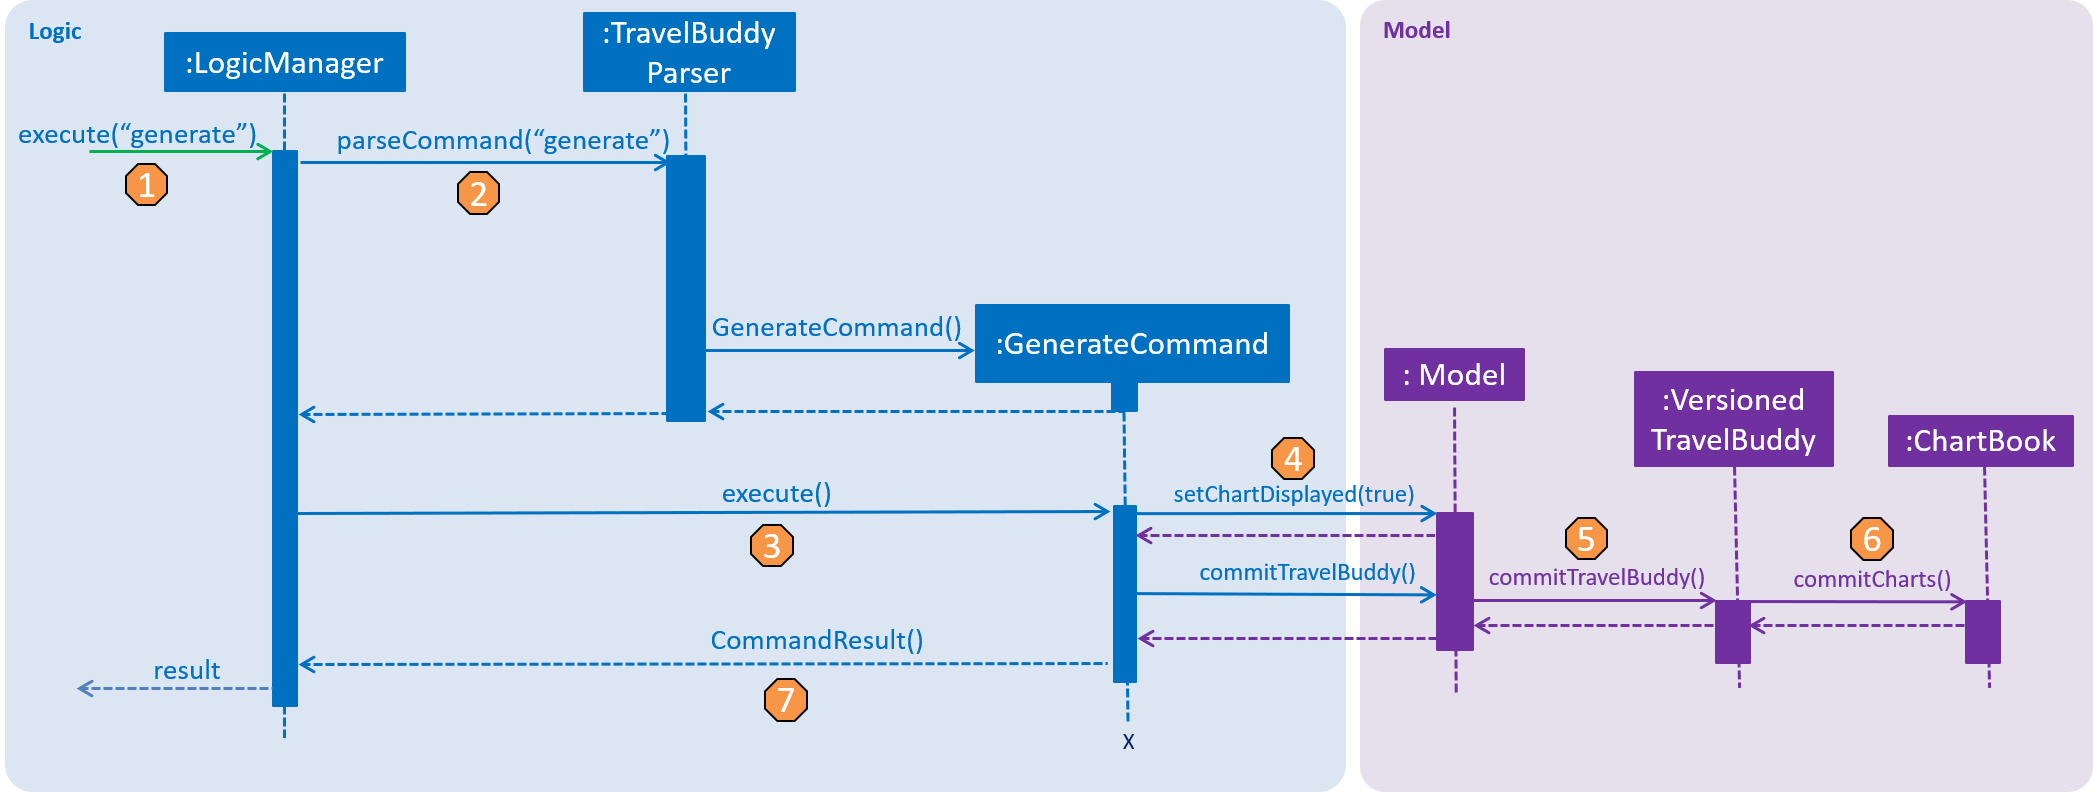
Additionally, we want to be able to capture the interaction between multiple objects for the generate command. This can be accomplished using a sequence diagram, as seen in Figure 4.5.1.3 below. The step-by-step explanation of the sequence diagram is as follows:
-
The user enters the command
generatewithout any parameters. -
The command is processed by the Logic component, which will then call
LogicManager#execute(). -
The
GenerateCommand#execute()method is invoked. -
The
Model#setChartDisplayed()method is invoked with the argumenttrue. TheModel#commitTravelBuddy()method is also invoked. -
The
TravelBuddy#commitTravelBuddy()method is invoked byModel. -
The
ChartBook#commitChart()method is invoked byTravelBuddy. -
The
CommandResultobject is returned.
generate commandStorage: The Chart’s storage is handled by JsonChartBookStorage, which implements from ChartBookStorage. The three main data-storage methods it implements are:
-
saveCountryChart(filePath)- Saves the countries data into a JSON file. -
saveRatingChart(filePath)- Saves the ratings data into a JSON file. -
saveYearChart(filePath)- Saves the years data into a JSON file.
As an example, a code snippet for saveCountryChart(filePath) is shown below. In it, a third-party library called Gson was used to convert Java Objects into JSON and back. The Gson API can be found here. A step-by-step explanation is as follows:
-
saveCountryChartaccepts aReadOnlyCountryChartobject, which supplies data for the Country Chart, and aPathobject, which specifies the file path for theFileWriterto write into. -
Both objects are checked by
requireAllNonNullto make sure they are not empty. -
A
Gsonobject is instantiated using theGsonBuilder#setPrettyPrinting()#create()object. -
A
FileWriterobject is instantiated with thePathobject as its parameter. -
Assuming there are no exceptions,
Gson#toJson()object will serialize theReadOnlyCountryChartdata as aJsonObjectand place the stream onFileWriter. -
The
FileWriter#flush()will flush the stream. -
If an
IOExceptionoccurs, a warning message will be displayed by theLogger#warningobject.
public void saveCountryChart(ReadOnlyCountryChart countryChart, Path filePath) { (1)
    requireAllNonNull(countryChart, filePath); (2)
    Gson gson = new GsonBuilder().setPrettyPrinting().create(); (3)
    try {
        FileWriter fileWriter = new FileWriter(String.valueOf(filePath)); (4)
        gson.toJson(countryChart, fileWriter); (5)
        fileWriter.flush(); (6)
    } catch (IOException ioe) {
        logger.warning(ioe.getMessage()); (7)
    }
}
4.1.2. Generate Command
Preconditions: Given below is a list of preconditions that must be met for the generate command to work:
-
By default, the charts are automatically generated each time TravelBuddy loads.
-
The
generatecommand always triggers the display of all three charts. -
The charts always update themselves in real-time.
Example: When a place is added via theaddcommand, the charts are automatically updated so that nogeneratecommand is necessary. -
The chart will not display anything when the list is empty.
-
You can type in any parameters after the
generatecommand, TravelBuddy will simply ignore them.
Example: Given below is an example usage scenario of the generate command.
Step 1: By default, the charts are displayed when TravelBuddy launches. To navigate away from the charts, type in select 1.
Outcome: The first index in the place list will be selected and displayed on the right-hand side of the panel.
Step 2: Type in generate to generate the charts.
Outcome: The charts will be displayed on the right-hand side of the panel.
4.1.3. Design Considerations
Aspect: How Chart Generation Executes
Given below is a comparison between the alternatives of the generate mechanism design.
| Alternative 1 (current choice) | Alternative 2 | |
|---|---|---|
Description |
Updates the charts both in real-time and when the |
Updates the charts only when the |
Pros |
Ease-of-use. This approach is more user-friendly, as users do not need to type an additional |
Scalability. This approach is computationally less intensive, as the charts are only generated when required. |
Cons |
Scalability. This approach is computationally more intensive, especially when the Place list is huge, as all three charts need to be regenerated every time a change is detected. |
Ease-of-use. This approach is Less user-friendly as users will need to type the |
Example |
As shown in Figure 4.5.3.1, before the |
N.A. |
Decision: Alternative 1, which is to update the charts in real-time, was adopted as it promotes ease-of-use, so users are not required to type in an additional generate command whenever changes are made to the Place list. Moreover, Alternative 1 is the more accurate option of the two, as the chart reflects the latest changes even if the user forgets to type the generate command.
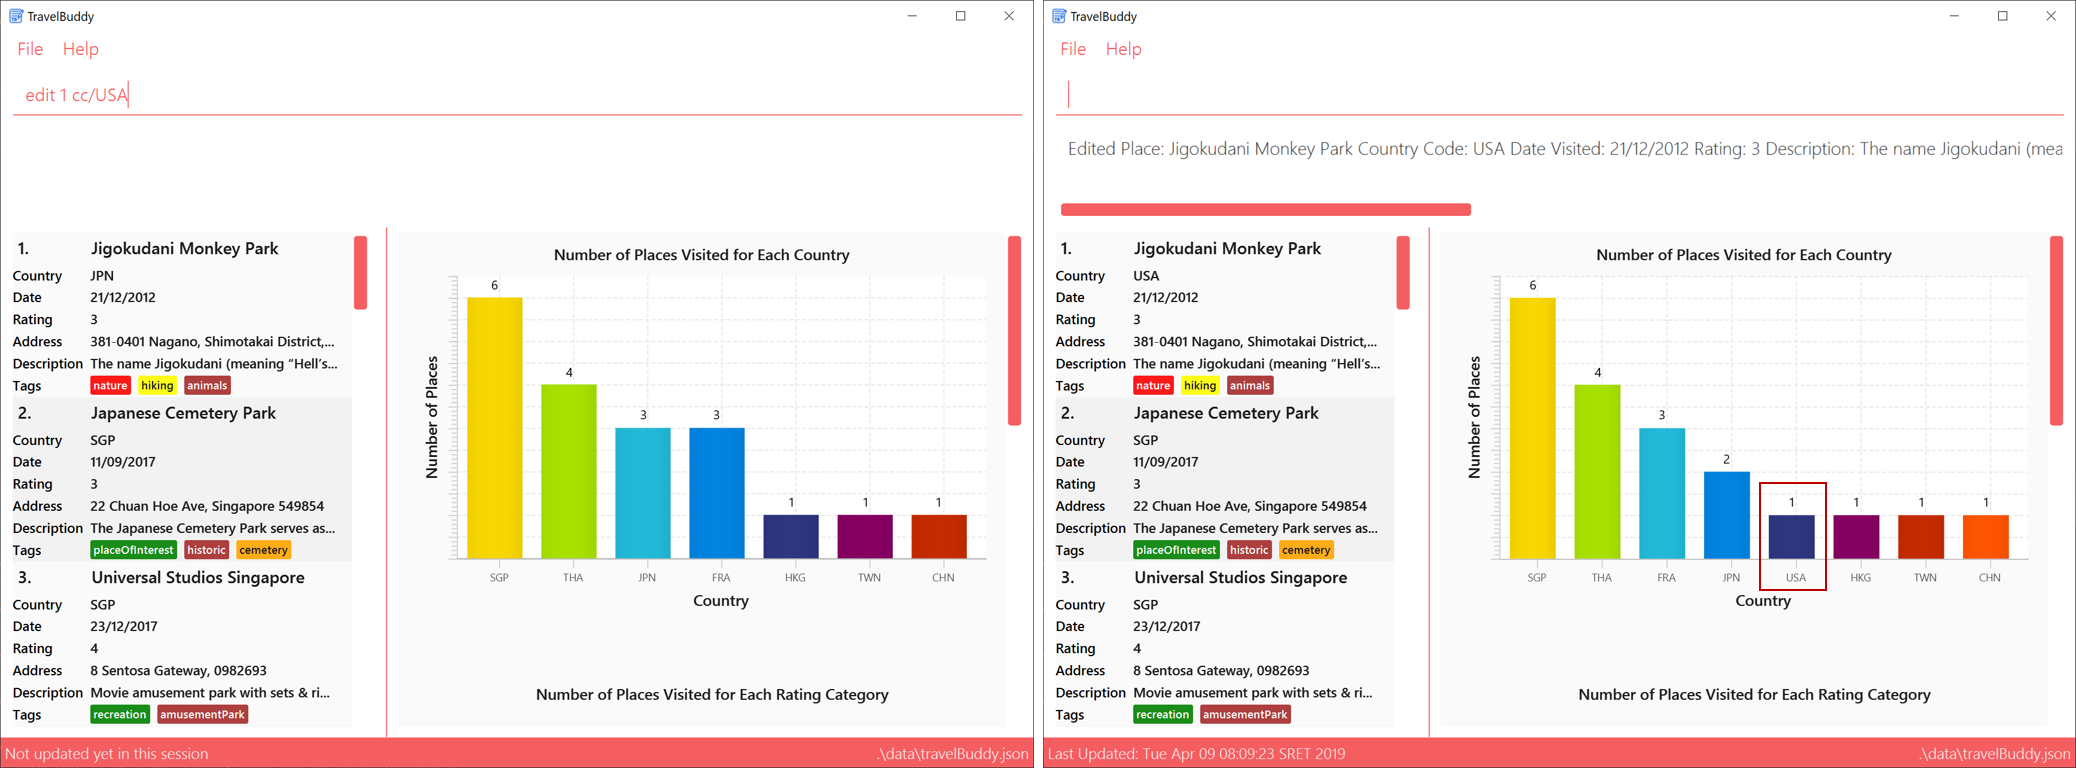
edit command was executed